Argos: Network Performance Monitoring and Analytics System
Developed during a year-long research project in collaboration with Tata Communications, a leading enterprise internet service provider, Argos is a sophisticated Network Performance Monitoring and Analytics System. Designed to address the unique challenges of enterprise networks, the platform enables administrators to monitor critical metrics such as latency, jitter, and packet loss, while leveraging predictive analytics for proactive issue resolution.
Timeline
June 2016 - May 2017
Contributions
User Research, Predictive Analytics Implementation, Dashboard Design, Data Visualization, Frontend and Backend Development, MEAN Stack Integration
Here’s a quick rundown
What did I do?
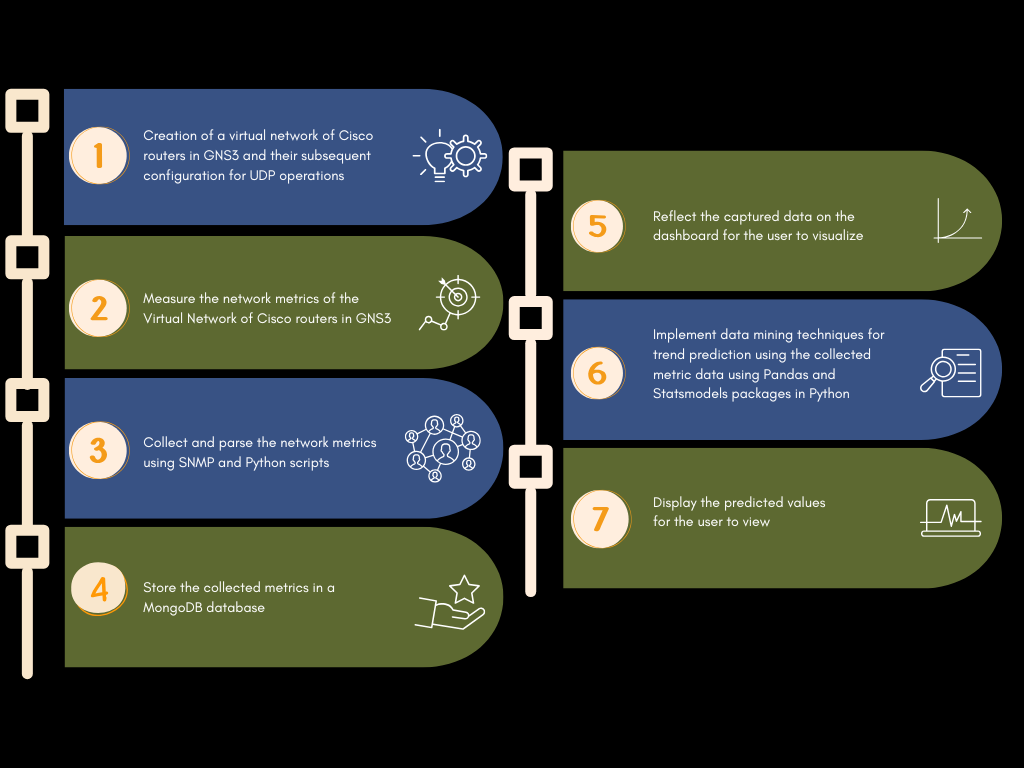
Developed Argos, a Network Performance Monitoring and Analytics System, as part of a year-long research project in collaboration with Tata Communications. Designed and implemented an interactive dashboard by conducting user research with network administrators, identifying pain points, and creating wireframes that simplified data visualization and navigation. Integrated predictive analytics using autoregression models to forecast network trends and proactively address potential issues.
What impact did it have?
The system empowered network administrators to monitor performance metrics like latency, jitter, and packet loss in real-time, improving their ability to anticipate and resolve network inefficiencies through actionable insights.
What did I learn?
I learned the value of user-centered design and predictive analytics in addressing real-world challenges, while refining my ability to align technical solutions with user and business needs.
Project Overview
Collaborators
Tata Communications network administrators and technical teams
Research participants, including network administrators and engineers
Target Audience
Primary: Network administrators seeking tools for real-time performance monitoring and predictive analytics
Secondary: Technical teams and non-technical stakeholders requiring simplified data visualization for decision-making
Challenges
Administrators faced difficulties interpreting unstructured network performance data
Limited predictive capabilities made it challenging to anticipate and address issues proactively
Existing tools lacked intuitive interfaces, making data interpretation difficult for non-technical users
Goals
Develop an intuitive, interactive dashboard for real-time monitoring of network metrics such as latency, jitter, and packet loss
Integrate predictive analytics to forecast trends and enable proactive issue resolution
Create user-friendly visualizations to simplify data interpretation and enhance decision-making across technical and non-technical teams